|
Alien Plants
|
| |
|
The effect of alien plant species on native plant richness
and community composition in urban
mid-age Sugar Maple (Acer saccharum) dominated forests
in London, Ontario
Page 6 of 9 |
| |
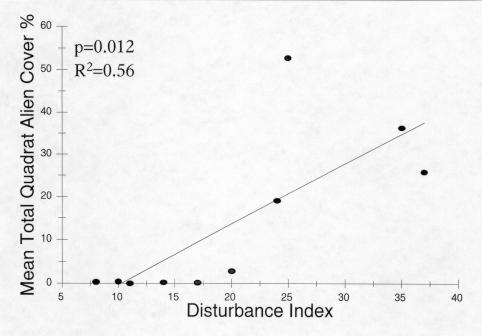
| Effect of Disturbance Following the PCA, which indicated the importance of disturbance in the
amount of Garlic Mustard at a site, the disturbance index was tested against its
effect on alien and native plants. Total alien cover was tested against the
disturbance of the site (Fig. 25). There was a positive and significant
(p=0.012, R2=0.56) relationship between these factors. Disturbance
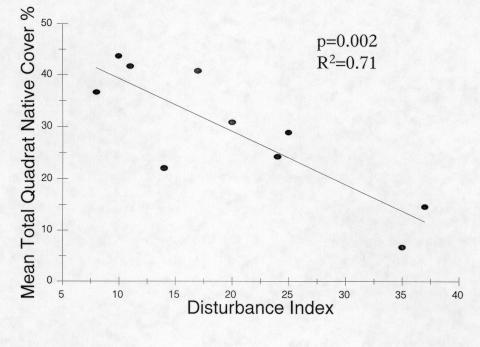
was then tested against total native cover % (Fig. 26). This relationship was
also significant at p<0.01 and negative. A relatively large amount of
variation was accounted for (R2=0.71).Values in this relationship
should be treated with caution because disturbance was measured as an index, but
the trend is clear. Mean quadrat MCC was also negatively correlated with the
disturbance index (p<0.05, R2=0.50). |
| |
|
|
|
Figure 25. Relationship between disturbance index and
mean quadrat alien species cover %. |
| |
|
|
|
Figure 26. Relationship between disturbance index and
mean quadrat native species cover %. |
| |
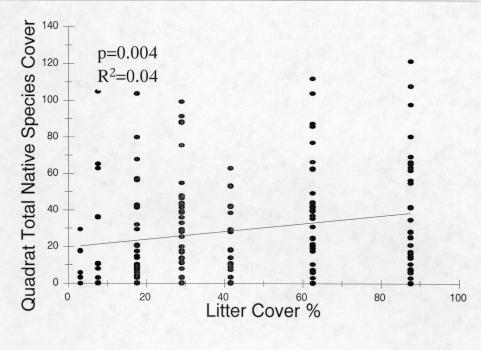
| Additional Factors As a result of the PCA, several other important variables
were tested. Total quadrat native cover % was tested against litter cover %
(Fig. 27). The relationship was significant (p<0.01) and positive, but with a
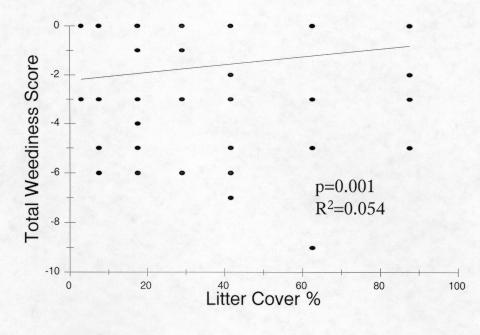
very weak R2 (0.04). Total Weediness Score and litter cover were
significant (Fig. 28, p<0.01) but again, the relationship was weak (R2=0.054).
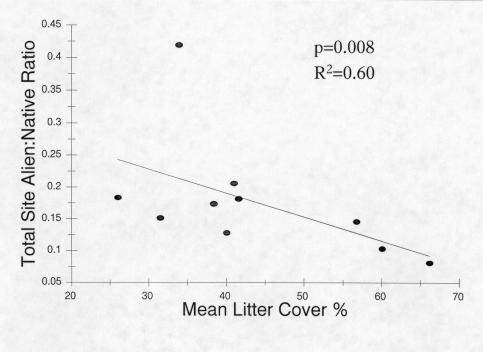
Mean litter cover was negatively correlated (p<0.01) with ratio of
alien/native species at each site (Fig. 29). This relationship was also quite
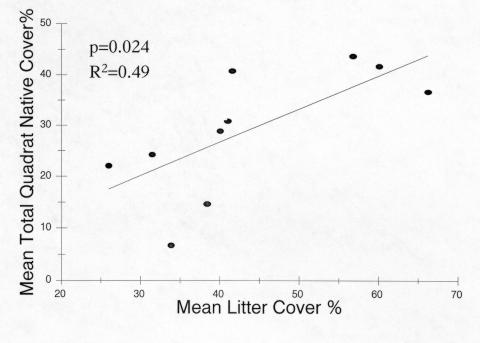
strong, with 60% of the variance explained. Mean litter cover was tested against
mean quadrat total native cover (Fig. 30). The relationship was positive and
significant (p<0.05, R2=0.49). |
| |
|
|
|
Figure 27. Relationship between quadrat litter cover %
and total quadrat native cover %.
|
| |
|
|
|
Figure 28. Relationship between quadrat litter cover %
and total quadrat weediness score.
|
| |
|
|
|
Figure 29. Relationship between site mean litter cover %
and total site alien : native richness ratio.
|
| |
|
|
|
Figure 30. Relationship between site mean litter cover %
and mean total site native cover %. |
| |
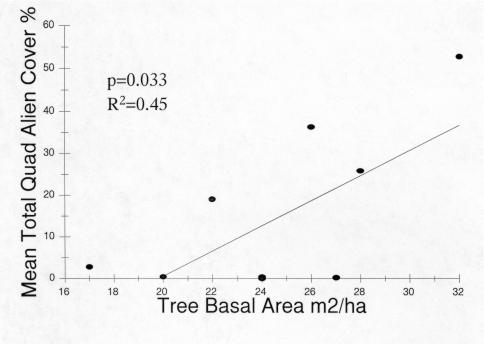
| Total alien cover was plotted against tree basal area
(Fig. 31). This was positive, significant (p<0.05) and relatively strong (R2=0.45). |
| |
|
|
|
Figure 31. Relationship between site tree basal area and
mean total quadrat alien cover %.
|
| |
|
Previous Page
Next Page
Copyright © Peter Moc
|
|
|
| |
| |

